~~~ Algo Trading with C/C++ - Code Examples ~~~
Due to their speed and flexibility,
C++ or
C are the best suited languages for algorithmic trading and
HFT. Find below some typical lite-C scripts for automated trading, financial
data
analysis, or other purposes. To learn algorithm programming in C or C++, begin with a
tutorial. To convert code
of other platforms - Easylanguage, Metastock, Pinescript, AFL, MQL4,
etc - read about trading code
migration. To check out a
specific trading function, follow its link in the
function list.
And if you don't want to code yourself, request a quote for
outsourcing your algo trading project.
Download Price History
~~~~~~~~~~~~~
Download daily price history from an online source.
function main()
{
  StartDate = 20100101; // YYYYMMDD format
  EndDate = NOW;  // up to today
  assetHistory("AAPL",FROM_YAHOO); // download AAPL data
}
Trivial Trading System
~~~~~~~~~~~~~~
Basic trend following system that enters a long position when the
close price crosses the moving average from below, and a short
position when it crosses from above. Exit by adaptive stop and reversal.
function run() // at any bar
{
  vars MovingAverages = series(SMA(seriesC(),300));
  Stop = ATR(100); // set stoploss distance dependent on volatility
  if(crossOver(seriesC(),MovingAverages))
    enterLong(); // exit short, enter long on Price/MA cross
  else if(crossUnder(seriesC(),MovingAverages))
    enterShort(); // and vice versa
}
Broker Arbitrage HFT System
~~~~~~~~~~~~~
Detect and exploit tiny EUR/USD price differences of two
different forex brokers with a high frequency trading script.
Backtest with historical data from both brokers in tick
resolution.function main() // run at start
{
LookBack = 0; // no lookback period
set(TICKS); // tick-based backtest
History = "*.t1"; // tick-based historical data file
assetList("AssetsArb.csv"); // asset list with symbols
}
function tick() // the HFT part; runs at any incoming tick
{
asset("EURUSD_A"); // EUR/USD from broker A
var SpreadA = marketVal(), PriceA = priceC();
asset("EURUSD_B"); // EUR/USD from broker B
var SpreadB = marketVal(), PriceB = priceC()
var Threshold = 1.5*(SpreadA + SpreadB);
var Difference = PriceA - PriceB;
asset("EURUSD_A");
if(NumOpenShort and Difference < 0)
exitShort(); // take profit
else if(NumOpenLong and Difference > 0)
exitLong(); // take profit
else if(!NumOpenShort and Difference > Threshold)
enterShort(); // go short with the expensive asset
else if(!NumOpenLong and Difference < -Threshold)
enterLong(); // go long with the cheap asset
asset("EURUSD_B");
if(NumOpenShort and Difference > 0)
exitShort();
else if(NumOpenLong and Difference < 0)
exitLong();
else if(!NumOpenShort and Difference < -Threshold)
enterShort();
else if(!NumOpenLong and Difference > Threshold)
enterLong();
}
Machine Learning System
~~~~~~~~~~~~~~
Feed several price curve characteristics, such as the recent
high/low ranges and momentums, to a decision tree trading
algorithm. Use the prediction from the decision treee for
entering long or short positions. This system uses walk-forward
analysis, which is mandatory for optimized strategies or machine
learning algorithms.
function run()
{
  set(RULES); // generate trading rules
  StartDate = 2012;
  EndDate = 2022; // backtest / training period
  BarPeriod = 240; // 4 hours
  LookBack = 200;
  NumWFOCycles = 10; // activate walk-forward analysis
  ReTrainDays = 60; // re-train live system every 2 months

  while(asset(loop("EUR/USD","AUD/USD","GBP/USD")))
  {
// generate signals for a decision tree
    var Range1 = priceH(0)-priceL(0);
    var Range2 = priceH(1)-priceL(1));
    var Trend = priceC(0)-SMA(seriesC(),LookBack);
    var Momentum1 = priceC(0) - priceC(1);
    var Momentum2 = priceC(1) - priceC(2);

    if(Train) Hedge = 2; // allow long+short in training
    LifeTime = 1440/BarPeriod; 	// 1 day prediction horizon

// generate decision tree, train on trade returns,
// predict next trade in test/live mode
    var LongPrediction = adviseLong(DTREE+RETURNS,0,
      Range1,Range2,Momentum1,Momentum2,Trend);
    var ShortPrediction = adviseShort(DTREE+RETURNS,0,
      Range1,Range2,Momentum1,Momentum2,Trend);
    if(Train or (LongPrediction > 0 and ShortPrediction < 0))
      enterLong(); // in training or at favorable prediction
    if(Train or (ShortPrediction > 0 and LongPrediction < 0))
      enterShort();
  }
}
Options Selling System
~~~~~~~~~
This algo trading strategy exploits the option sellers advantage. It
finds call and put options of the same premium and enters 6-week
strangle combos. If an option expires in the money and is
exercised, the underlying is immediately sold.
void run()
{
  BarPeriod = 1440; // 1 day
  BarZone = EST;
  BarOffset = 9*60+30; // market open time
  asset("SPY");

// load today's contract chain
  if(!contractUpdate(Asset,0,CALL|PUT)) return;
// wait until previous combo was expired or exercised
  if(NumOpenShort) return;
// if excercised, sell remaining underlying at market
  contractSellUnderlying();

// open a new put/call strangle
  int Days = 45; // minimum days to expiration
  var Premium = 3; // get 600 dollars per combo
  Multiplier = 100;
  if(combo( // find matching options
    contractFind(CALL,Days,Premium,2),1,
    contractFind(PUT,Days,Premium,2),1,
    0,0,0,0))
  {
    MarginCost = comboMargin(-1,3);
    enterShort(comboLeg(1)); // sell combo
    enterShort(comboLeg(2));
  }
}
Indicator (Laguerre Filter)
~~~~~~~~~~~~~~~
The Laguerre filter is a low-lag lowpass filter, excellent for
trend following systems and superior to traditional SMA or
EMA indicators.
var Laguerre(vars Data, var alpha)
{
  var alpha1 = 1.-alpha;
  vars L = series(Data[0],8);
  L[0] = alpha*Data[0] + alpha1*L[1];
  L[2] = -alpha1*L[0] + L[1] + alpha1*L[3];
  L[4] = -alpha1*L[2] + L[3] + alpha1*L[5];
  L[6] = -alpha1*L[4] + L[5] + alpha1*L[7];
  return (L[0]+2.*L[2]+2.*L[4]+L[6])/6.;
}
Plot Average Spread by Hour
~~~~~~~~~~~~~
This script visualizes the average ask-bid spread of the selected asset
on any hour of the day in a histogram chart. Forex pairs often
have spread jumps between the US and pacific session. Do not
trade during that time.
function run()
{
  BarPeriod = 15;  // 15 minutes per histogram bar
  StartDate = 2019;
  EndDate = 2022;
  plotBar("Spread",(60*hour(0)+minute(0))/BarPeriod,tod(0),
    marketVal(0),AVG|BARS,RED);
}
Plot Price Distribution
Histogram ~~~~~~~~~~~~
Compares the price distributions - the frequencies of prices - of
two assets. Assets with an unusually small price distribution
- smaller than the classical bell curve - can be used for channel trading, for instance with a grid
trading system.
function run()
{
  BarPeriod = 60;
  StartDate = 2019;
  EndDate = 2022;
  asset("EUR/CHF");
  var PriceCHF = price(0);
  asset("EUR/USD");
  var PriceUSD = price(0);
  plotBar("EUR/CHF",1000*PriceCHF,PriceCHF,1,SUM|BARS,RED);
  plotBar("EUR/USD",1000*PriceUSD,PriceUSD,1,SUM|BARS,GREEN);
}
Plot Price Cycles Spectrum
~~~~~~~~~~~~~~~~
Displays a frequency spectrum, i.e. the strength of any
cycle of the price curve, over the last month.
function run()
{
  BarPeriod = 60;
  StartDate = ymd(wdate(NOW)-30); // last 30 days
  EndDate = ymd(wdate(NOW));
  LookBack = 2000;
  int Cycle;
  for(Cycle = 10; Cycle < 200; Cycle++)
    plotBar("Spectrum",Cycle,Cycle,
      Spectrum(Price,Cycle,4*Cycle),BARS|AVG,BLUE);
}
Plot Order Flow
Profile ~~~~~~~~~~~~~~~~~~~
Reads the order book from the connected broker and plots an
ask/bid profile that makes imbalances in the order flow
immediately visible.
function main()
{
  StartDate = NOW;
  asset("BTC/USD");
// load current order book
  int N = orderUpdate("BTCUSD",1);
  T2* Quotes = dataStr(1,OrderRow,0);
  printf("\nOrderbook: %i quotes",N);
// evaluate order book +/- 5% range
  var Distance = 0.05*priceC(0);
  int N2 = orderCVD(Quotes,N,Distance);
  printf(", %i in 5% range",N2);
  var Level = priceC(0) - Distance; // start level
  int i;
  for(i=0; i<100; i++) {
    Level += Distance/50;
    plotBar("Ask",i,Level,cpd(Level),BARS|LBL2,RED);
  }
  Level = priceClose() - Distance;
  for(i=0; i<100; i++) {
    Level += Distance/50;
    plotBar("Bid",i,Level,cpd(-Level),BARS|LBL2,BLUE);
  }
}
Non-Linear Reinvestment
Calculator ~~~~~~~~
Systems with high leverage require non-linear reinvestment of
profits for limiting drawdown depths. Set up initial
capital, accumulated profit, and linearity with the 3 Zorro
sliders and get the suggested reinvestment amount. The rest of the
profit should remain on the account for buffering drawdowns.
function main()
{
  slider(1,10000,1,20000,"Capital","Initial capital");
  slider(2,10000,0,20000,"Profit","Collected profit");
  slider(3,2000,1000,2000,".Root","Nth root");
// N = 1.000 for linear reinvesting,
// N = 2.000 for square root reinvesting
  while(wait(100)) // update info while moving sliders
    print(TO_INFO,"Investment: $%.0f",
      slider(1)*pow(1+slider(2)/slider(1),
      1./(0.001*slider(3))));
}
Mass text replacing
~~~~~~~~~~~~~~~~~~~
Example for working with files and text strings.
Insert a "viewport" statement in the headers of all HTML files
in a folder, then upload the changed files via FTP to a web
server.
void main()
{
  string Folder = "c:\\project\\zorro\\manual\\",
  URL = "ftp://zorro-project.com/manual/en", // web server
  Old = "</head>", // where to insert
  New =
   "<meta name=\"viewport\" content=\"width=device-width\">\n</head>";
  string Buffer = zalloc(1000000); // just a large buffer
  string FileName = file_next(strf("%s*.htm",Folder)); // first file
  while(FileName) {
    string FilePath = strf("%s%s",Folder,FileName); // generate path
    string Content = file_content(FilePath); // read file into string
    if(Content && !strstr(Content,"viewport")) { // no viewport yet?
      strx(Buffer,1000000,Content,Old,New); // replace text
      file_write(FilePath,Buffer,0); // save modified file
      ftp_upload(URL,FilePath,"User","Password"); // upload to server
      printf("\n%s updated",FileName);
    }
    FileName = file_next(0); // get next file
  }
}
Print 2000 digits of Pi
~~~~~~~~~~~~~~~~~~~
With an algorithm from a math book.
void main()
{
  int num=0,a=10000,b,c,d,e=0,gg;
  int f[14000];
  for(b=14000; b>0; b--) f[b] = 2000;
  for(c=14000; c>0; c-=14) {
    d = 0;
    gg = c*2;
    for(b=c; b>0; b--)  {
       d += f[b]*a;
       gg--;
       f[b] = d%gg;
       d /= gg;
       gg--;
       d *= b;
    }
    printf("%.4d",e+d/a);
    e = d%a;
    num += 4;
  }
  printf("\n%d digits of pi calculated!",num);
}
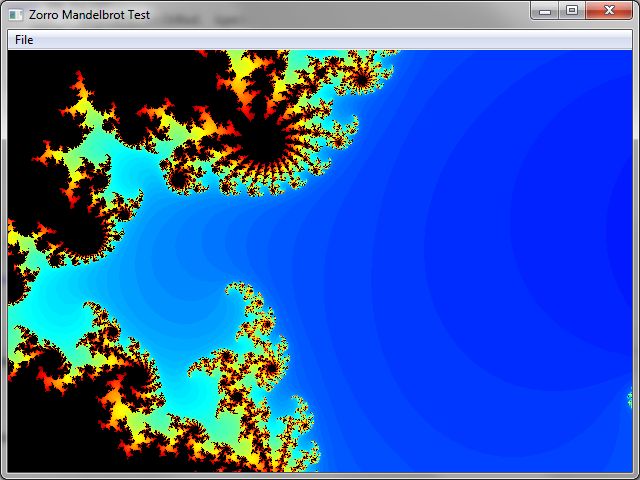
Display a Mandelbrot Fractal
~~~~~~~~~~~~~~~~~~~
Lite-C script of a standard Windows app with window
class, menu, message
loop, and interactive graphics. For hardcore programmers only!
 #include <windows.h>
LRESULT CALLBACK WndProc(HWND hWnd,
UINT message, WPARAM wParam, LPARAM lParam);
int WINAPI main(WINARGS)
{
//Create and register a window - the basic stuff
char *szClass = "ZorroWindowClass";
HINSTANCE hi = GetModuleHandle(NULL);
UnregisterClass(szClass,hi);
WNDCLASSEX wcex;
wcex.cbSize = sizeof(WNDCLASSEX);
wcex.style = CS_HREDRAW|CS_VREDRAW;
wcex.lpfnWndProc = WndProc;
wcex.cbClsExtra = 0;
wcex.cbWndExtra = 0;
wcex.hInstance = hi;
wcex.hIcon = LoadIcon(hi,(LPCSTR)128);
wcex.hCursor = LoadCursor(NULL, IDC_ARROW);
wcex.hbrBackground = (HBRUSH)(COLOR_WINDOW+1);
wcex.lpszMenuName = NULL;
wcex.lpszClassName = szClass;
wcex.hIconSm = LoadIcon(hi,(LPCSTR)128);
RegisterClassEx(&wcex);
HWND hwnd=CreateWindowEx(0,szClass,
"Zorro Mandelbrot Test",0x96cf0000,0,0,640,480,NULL,0,NULL,NULL);
// now create a "Reset" and "Quit" menu
HMENU menu = CreateMenu();
HMENU hSubMenu = CreateMenu();
InsertMenu(hSubMenu,0,MF_BYPOSITION|MF_STRING,1,"Reset");
InsertMenu(hSubMenu,2,MF_BYPOSITION|MF_STRING,3,"Quit");
InsertMenu(menu,0,
MF_BYPOSITION|MF_STRING|MF_POPUP,(UINT_PTR)hSubMenu,"File");
// activate window, menu, and message loop
if(hwnd) {
SetMenu(hwnd,menu);
ShowWindow(hwnd,SW_SHOW);
MSG msg;
while(GetMessage(&msg, NULL, 0, 0)) {
TranslateMessage(&msg);
DispatchMessage(&msg);
}
}
return 0;
}
// convert value to color
long JetColor(double v)
{
double d = 25.0;
v = v/d + 0.5;
int f = (int)(255*(v-i));
int r=0, g=0, b=0;
switch((int)v) {
case 0: r=0; g=0; b=f; break;
case 1: r=0; g=f; b=255; break;
case 2: r=f; g=255; b=255-f;break;
case 3: r=255; g=255-f;b=0; break;
case 4: r=255-f;g=0; b=0; break;
}
return r|(g<<8)|(b<<16);
}
// Draw the Mandelbrot fractal.
double m_x = 0.344142,
m_y = 0.075094,
m_width = 0.017813;
void Draw(HDC hdc,long vw,long vh)
{
long w = (long)vw, h = (long)vh, i,j;
long detail=100;
if(w>0) {
for(i=0; i<w; i++)
for(j=0; j<h; j++) {
double x = m_x+((double)i)*m_width/w;
double y = m_y+((double)(h-j))*m_width/w;
double zx = 0,zy = 0;
int inset = 1, times = 0;
while(inset && times<detail) {
times++;
double zxs = zx*zx;
double zys = zy*zy;
zy = 2*zx*zy+y;
zx = zxs-zys+x;
if (zxs+zys >= 4.0) inset=0;
}
if(inset) SetPixel(hdc,i,j,0);
else SetPixel(hdc,i,j,JetColor(times));
}
}
}
}
// Windows message loop
LRESULT CALLBACK WndProc(HWND hWnd,
UINT message, WPARAM wParam, LPARAM lParam)
{
PAINTSTRUCT ps;
HDC hdc;
switch(message) {
case WM_RBUTTONDOWN: // reset to full fractal
m_x = -2.5;
m_y = -2;
m_width = 4.0;
InvalidateRect(hWnd,0,0);
break;
case WM_LBUTTONDOWN: { // zoom in at cursor position
RECT rect;
GetClientRect(hWnd,&rect);
long x = ((long)lParam)&0xffff;
long y = (((long)lParam)&0xffff0000)>>16;
double zoom = 0.5;
double a = x; a /= rect.right; m_x += m_width*(a-0.5);
a = y; a /= rect.bottom; m_y += m_width*(0.5-a);
m_width *= zoom;
InvalidateRect(hWnd,0,0);
break;
}
case WM_DESTROY:
PostQuitMessage(0);
break;
case WM_COMMAND:
switch(wParam) {
case 1:
m_x=-2.5; m_y=-2; m_width=4.0;
InvalidateRect(hWnd,0,0);
break;
case 2: break;
case 3:
PostMessage(hWnd, WM_CLOSE,0,0);
break;
}
break;
case WM_PAINT:
hdc = BeginPaint(hWnd, &ps);
RECT rect;
GetClientRect(hWnd,&rect);
Draw(hdc,rect.right,rect.bottom);
EndPaint(hWnd, &ps);
break;
case WM_KEYDOWN:
switch( wParam ) {
case VK_ESCAPE:
case VK_F12:
PostMessage(hWnd, WM_CLOSE,0,0);
break;
}
break;
default:
return DefWindowProc(hWnd, message, wParam, lParam);
}
return 0;
}
|